


.svg)


Channel Optimisation
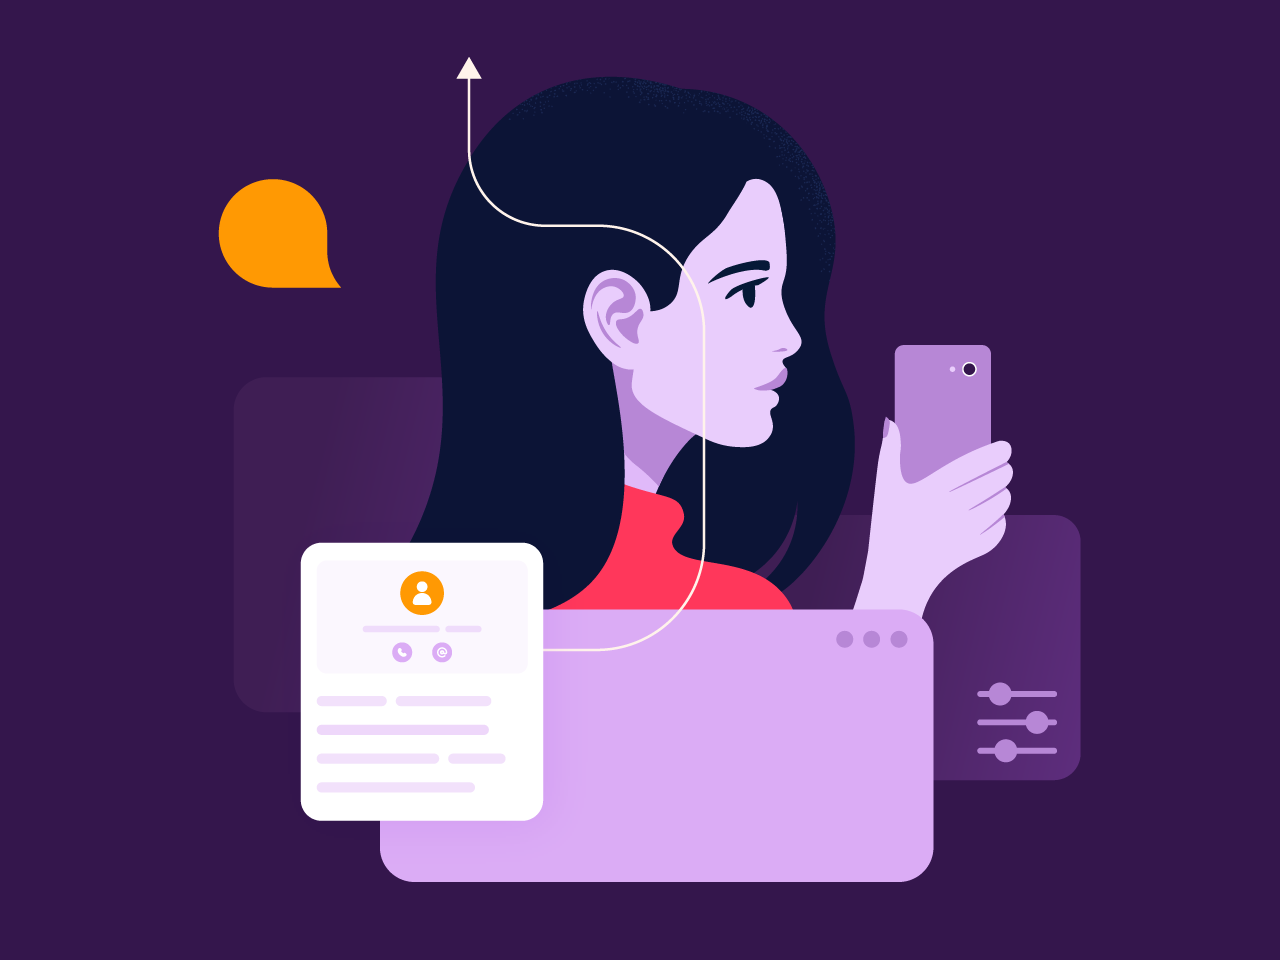
Meet your customers where they are.
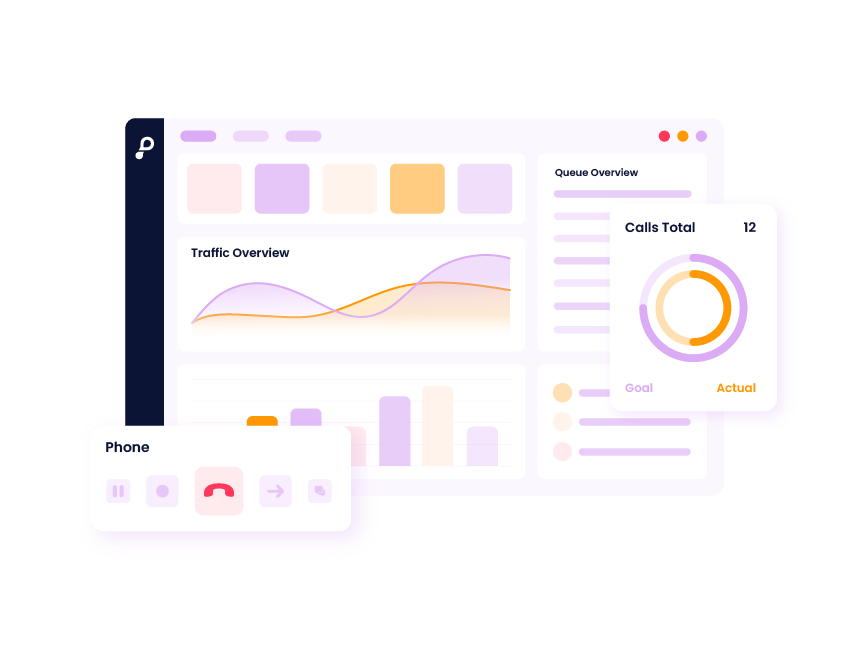
Customer expectations are higher than ever. Our mission is to ensure you have the right tools to exceed them. The Puzzel Contact Centre solution lets you create consistent customer journeys and meet your customers in the best channel for their query – whether it’s email, web, SMS, voice or social media. Plus, with a single interface and AI-enhanced tools, your agents have all they need to deliver quick, personalised responses.
Key features.


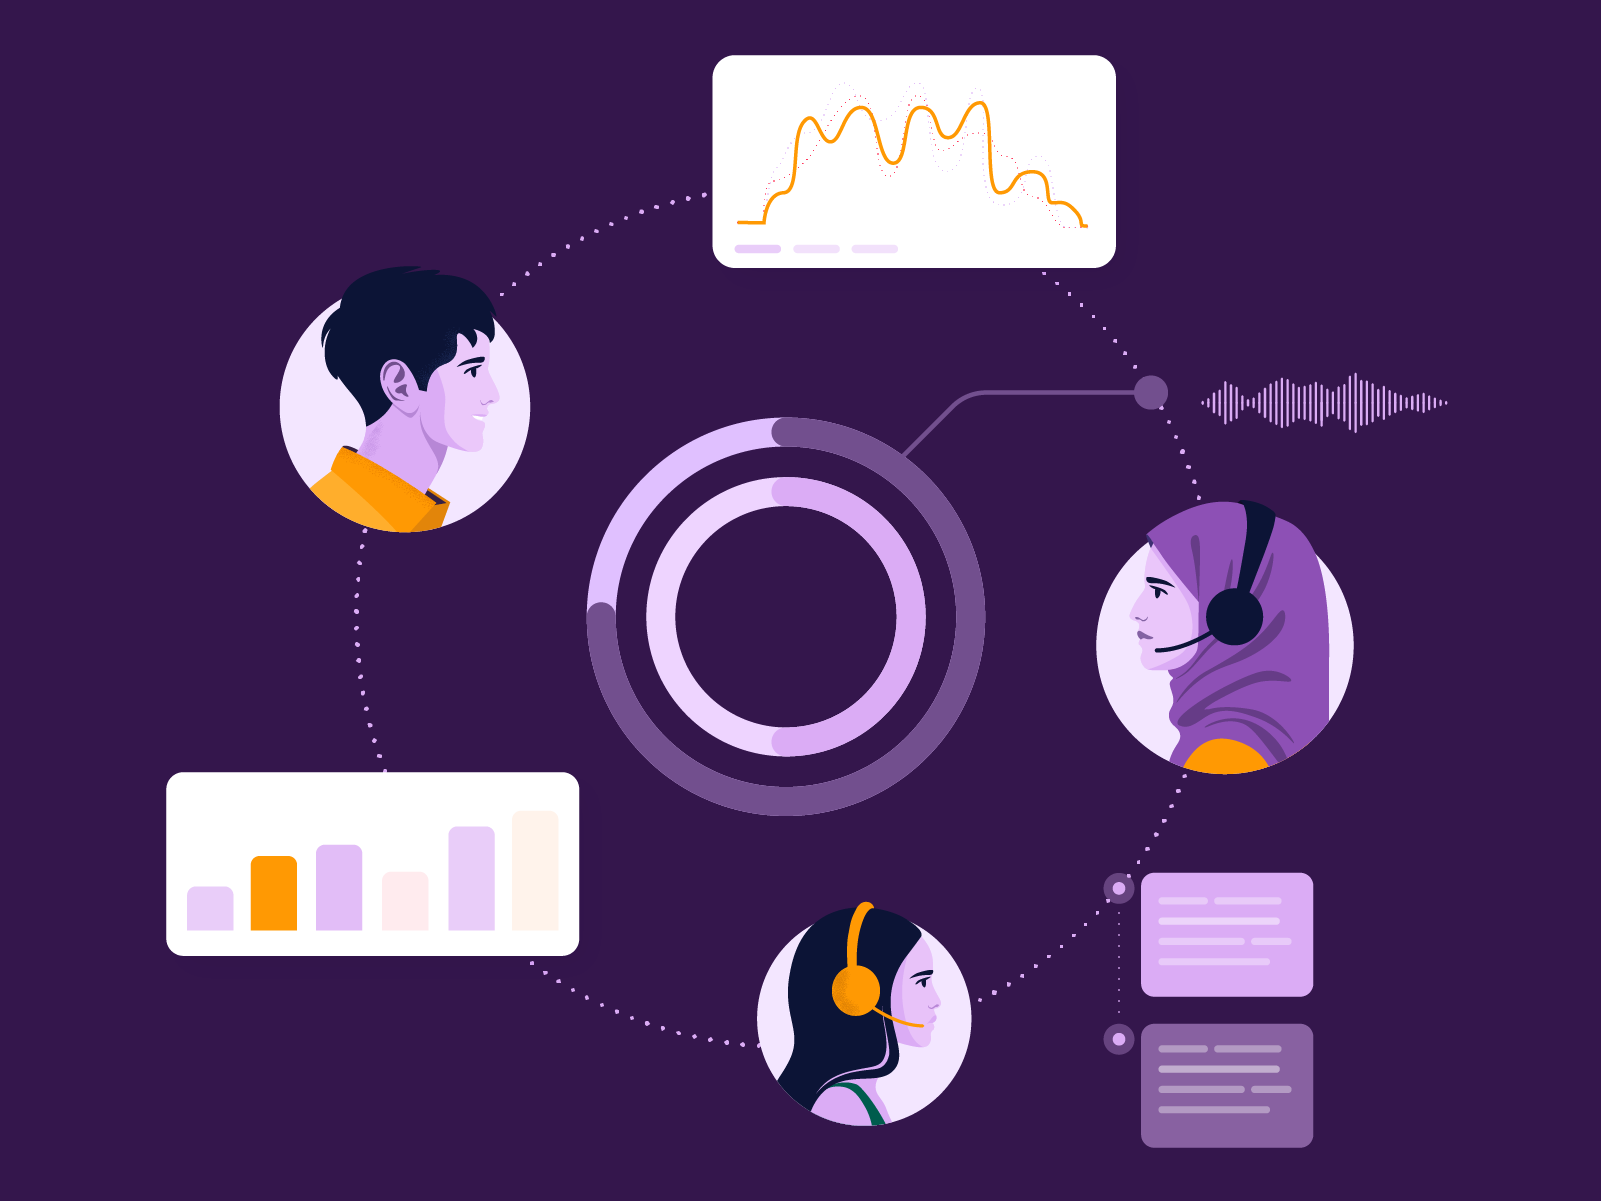
Unlock your team's potential with the Puzzel CX ecosystem.
Puzzel Contact Centre is part of the Puzzel CX Ecosystem which combines Contact Centre as a Service with Self-Service Automation capabilities. This helps you consolidate all your contact centre technologies in a single platform, so you can focus on what matters most – providing delightful customer experiences, regardless of channel.
.svg)


Yes, I want my customer care Norwegian style.
Puzzel Contact Centre is part of the Puzzel CX platform which combines Contact Centre as a Service with Self-Service Automation capabilities. This helps you consolidate all your contact centre technologies in a single platform, so you can focus on what matters most – providing delightful customer experiences, regardless of channel
